WebSocket overview

See which users are currently connected for real-time notifications at which workstation, and how many messages were sent.

X-Sitter pushes real-time notifications to the screens of your staff – for example when new orders arrive – over a so-called WebSocket connection. The WebSocket Overview (WebSocket Übersicht) shows you who is currently connected at which workstation and how many messages were sent. The Detailed Statistics (Detaillierte Statistiken) show the long-term development.

Before you start

  • Your user needs the permission WebSocket Overview in the Administration area of the permissions tree. Ask your administrator.
  • Real-time notifications must be activated for your company. Contact X-Sitter support to activate them. Until then the page shows WebSocket service not configured (WebSocket-Service nicht konfiguriert).

Step by step

See who is connected

  1. Open Administration › WebSocket Overview (Administration › WebSocket Übersicht).
  2. The table Currently connected (Aktuell verbunden) lists every connected user with:
    • User (Benutzer),
    • Workplace (Arbeitsplatz) – the workstation the user has chosen,
    • Connected since (Verbunden seit),
    • Sent today (Heute gesendet) – number of messages of this user today.
  3. Below it, System today (System (Cronjobs) heute) shows how many messages X-Sitter's automatic background tasks sent today.
  4. Statistics (max. 1 month) (Statistik (max. 1 Monat)) lists the messages per Date (Datum), split into API, Chat and Total (Gesamt).
  5. Click Update (Aktualisieren) to reload.

Look at the long-term statistics

  1. Click Detailed Statistics (Detaillierte Statistiken).
  2. Choose the period: 30 days, 90 days, 12 months or Everything (Alles).
  3. Read the key figures and charts (see table). To overview (Zur Übersicht) takes you back.
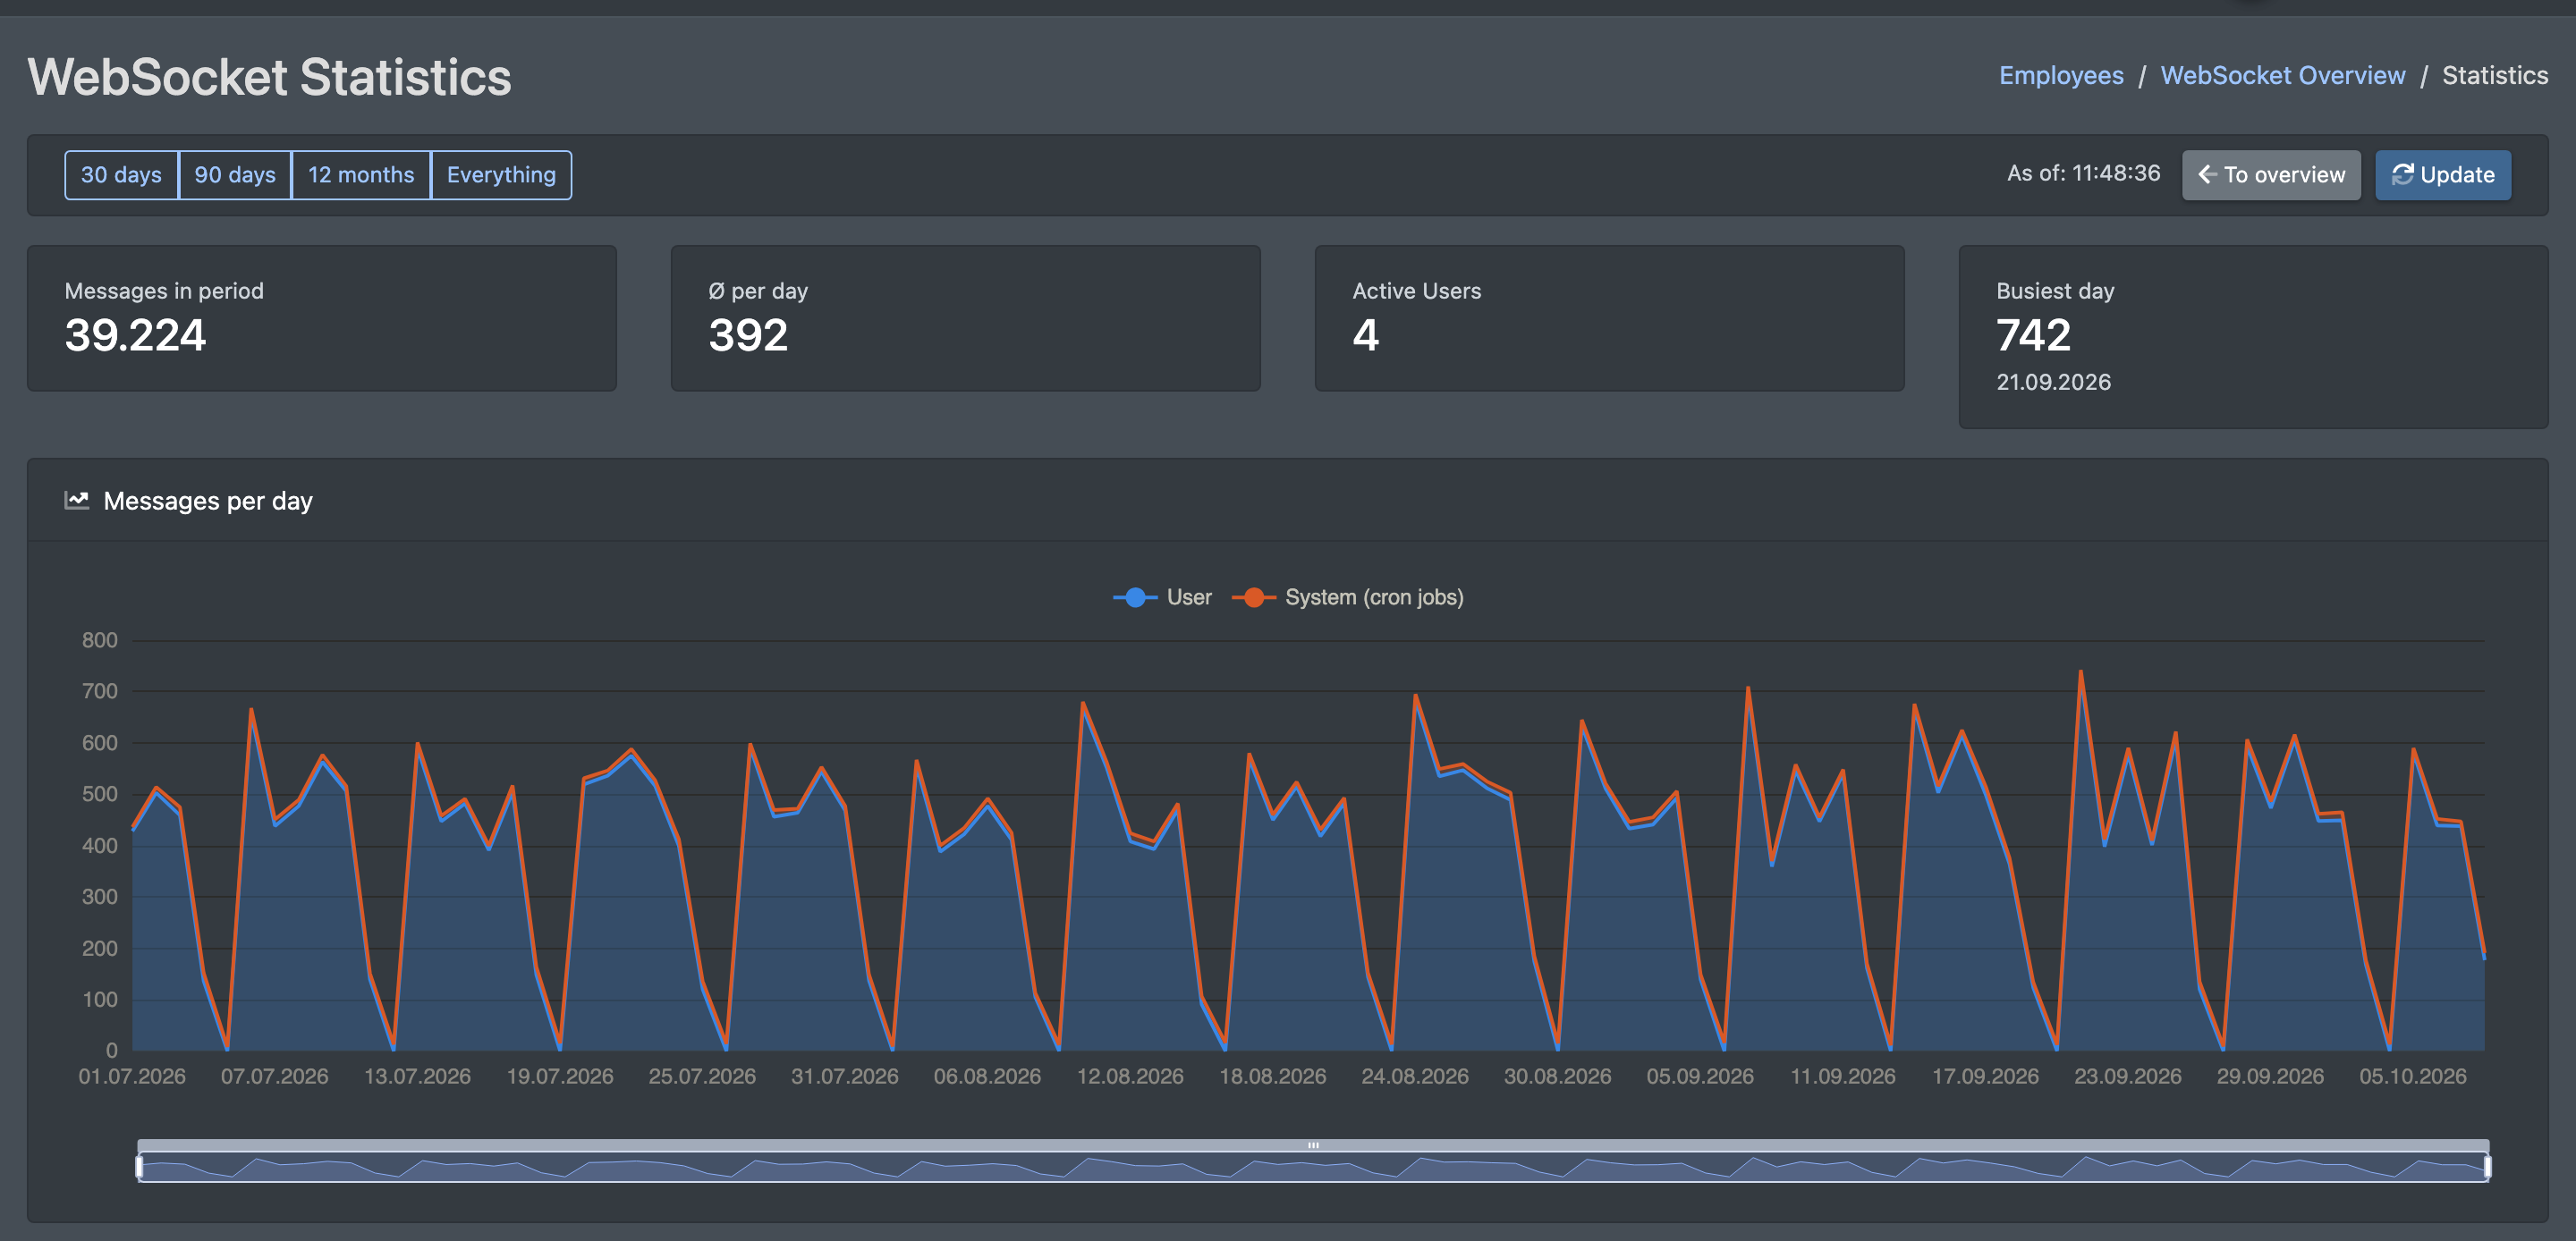
Screenshot: WebSocket Statistics page with period buttons, the four key figures and the messages-per-day chart

Key figures and charts

Element Meaning
Messages in period (Nachrichten im Zeitraum) Total number of messages in the chosen period.
Ø per day (Ø pro Tag) Average messages per day.
Active users (Aktive Benutzer) Number of users with message activity in the period.
Busiest day (Stärkster Tag) Day with the most messages.
Messages per day (Nachrichten pro Tag) Chart of the daily message count.
Share per user / Share per workplace (Anteil pro Benutzer / Anteil pro Arbeitsplatz) Distribution of the messages.
Ø messages per weekday (Ø Nachrichten pro Wochentag) Which weekdays are busiest.
Monthly overview (Monatsübersicht) Messages per month.
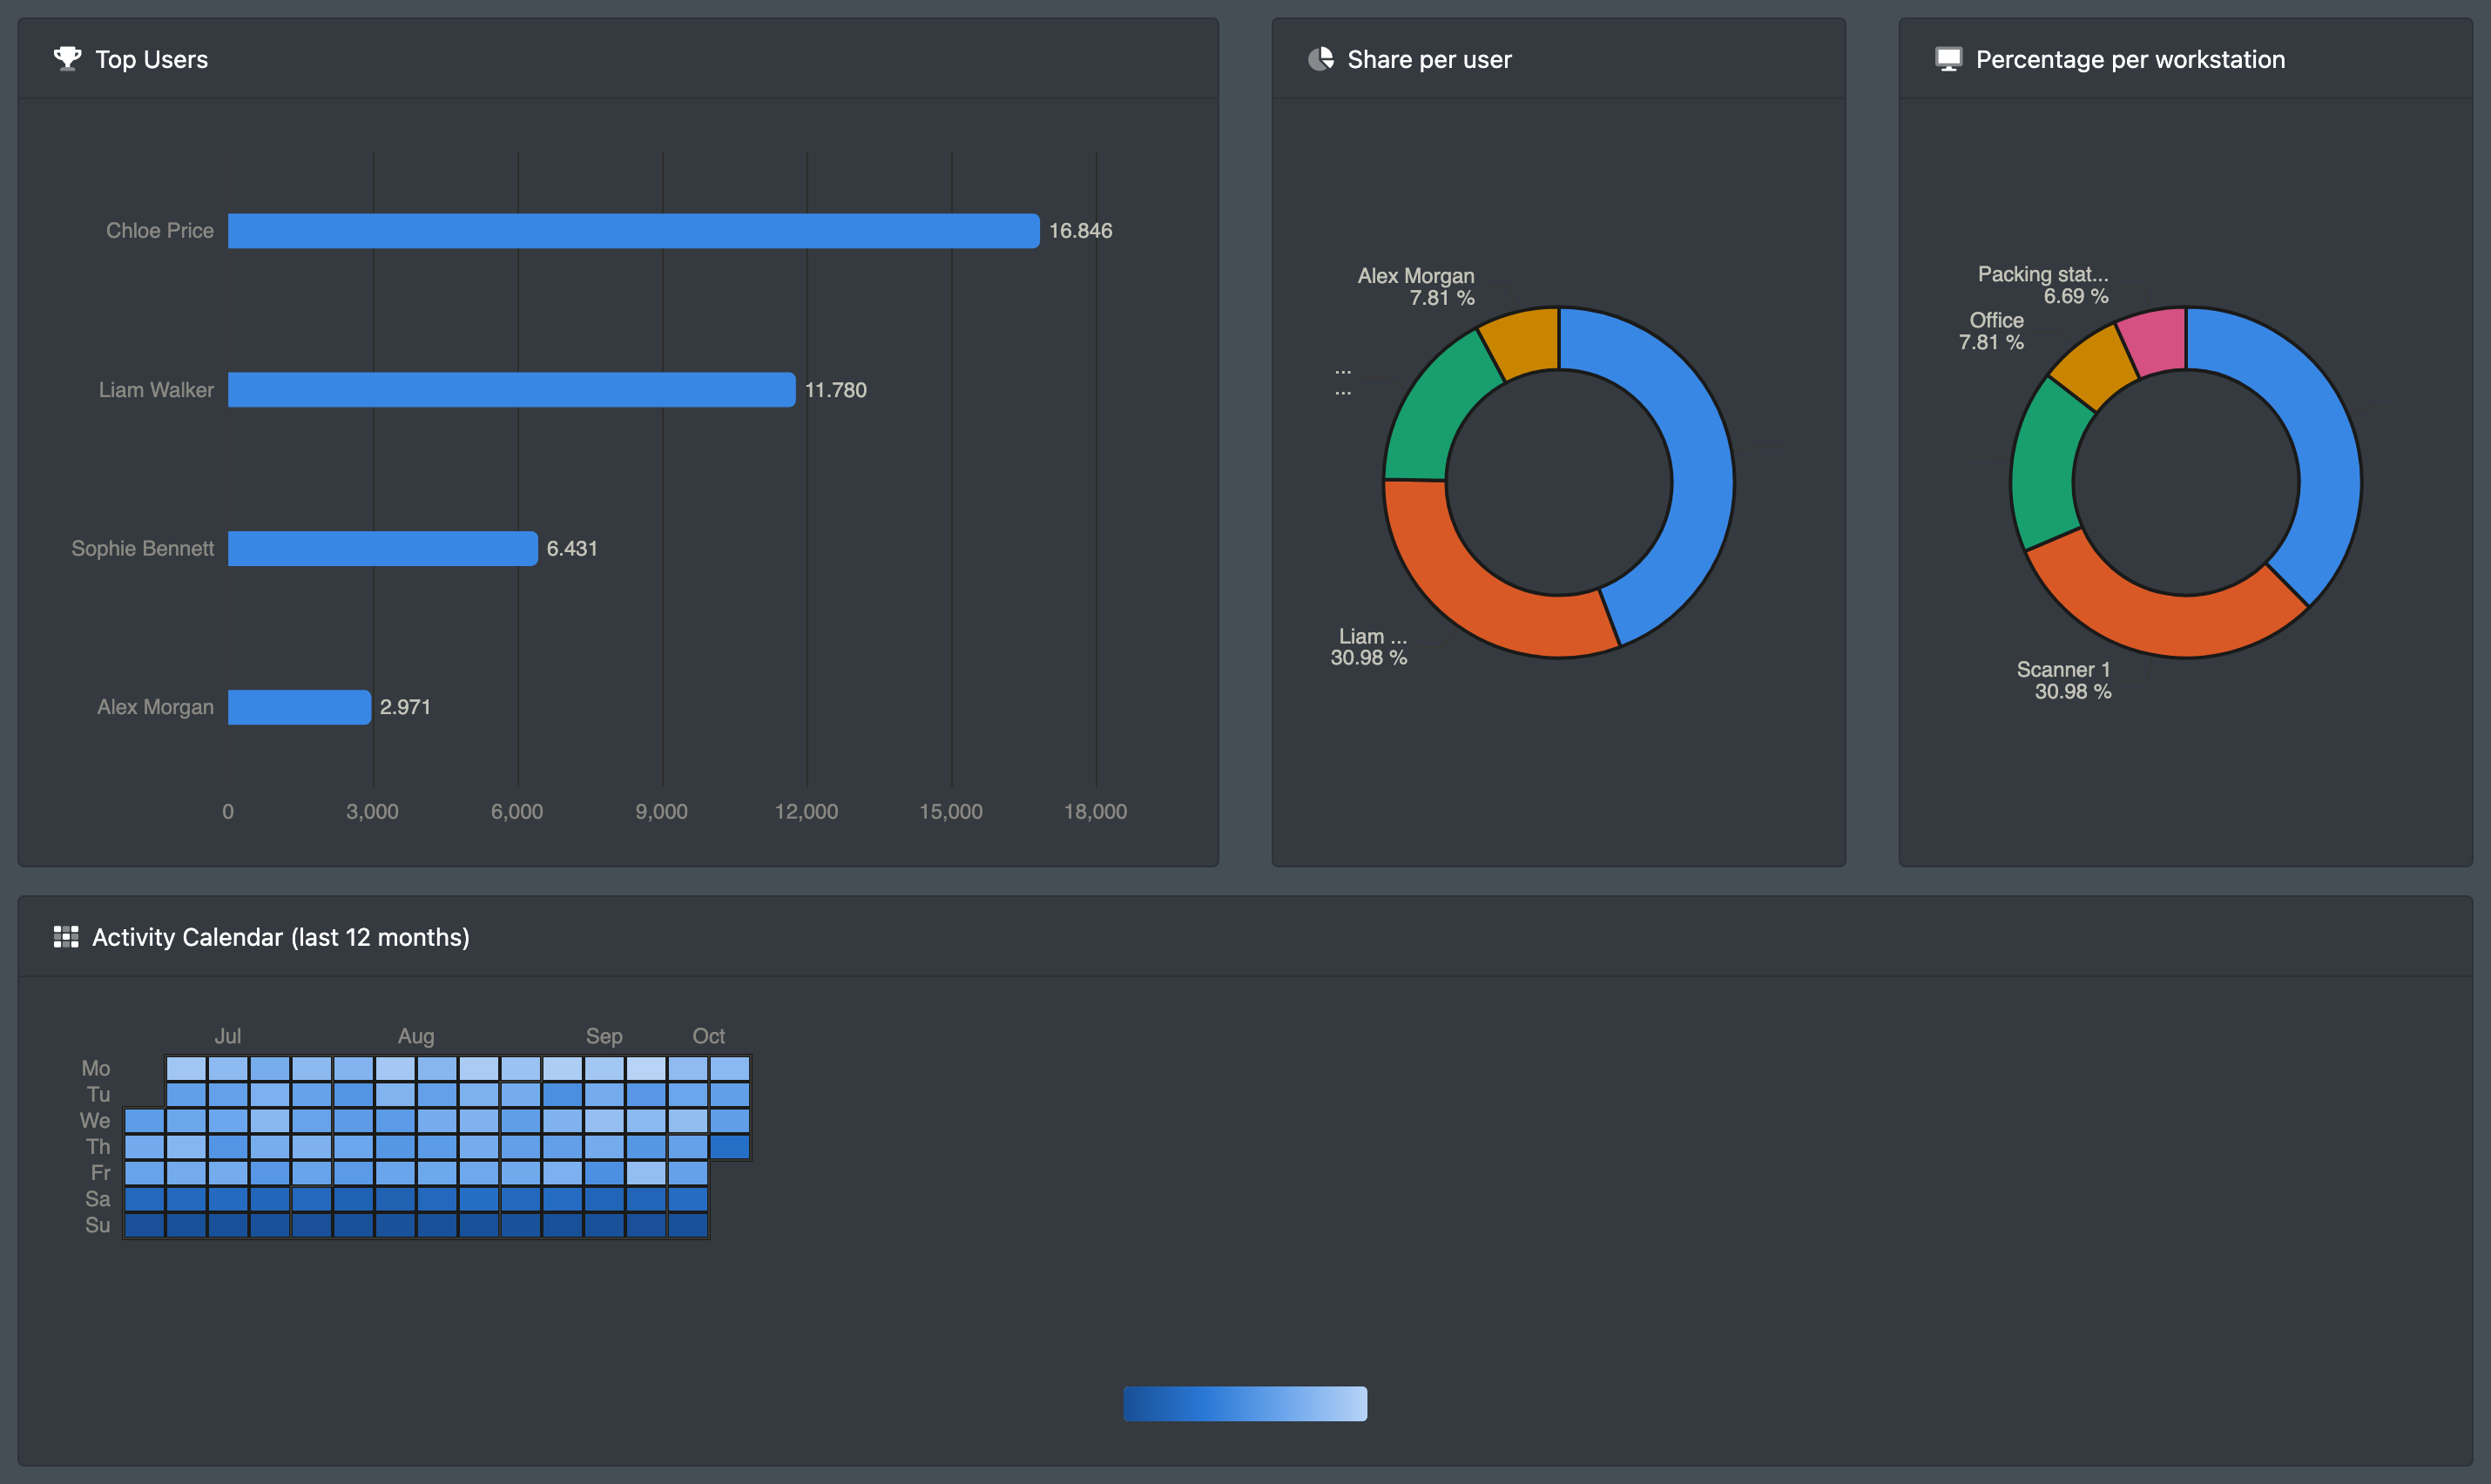
Top users (Top Benutzer) Users with the most messages.
Activity calendar (last 12 months) (Aktivitäts-Kalender (letzte 12 Monate)) Calendar heat map of the daily activity.
Screenshot: Activity calendar and top users list on the statistics page

Good to know / Troubleshooting

Message / situation Cause Solution
WebSocket service not configured – "No connection to the WebSocket service has been set up for this logistician yet." Real-time notifications are not activated for your company. Contact X-Sitter support.
"No statistics data has been collected yet…" (Es wurden noch keine Statistikdaten gesammelt.) The long-term statistics are filled once a day. On a new setup there is no data yet. Wait until the next day. If it stays empty, contact X-Sitter support.
A user is missing in "Currently connected" The user is not logged in, or the browser tab is closed. Ask the user to reload X-Sitter.
The overview only shows the last month The live counters only cover about one month. Use Detailed Statistics for longer periods.