
Warehouse dashboard
Key figures of your warehouse as charts – pallet trend, capacity, movements, top sellers, lead times and top clients
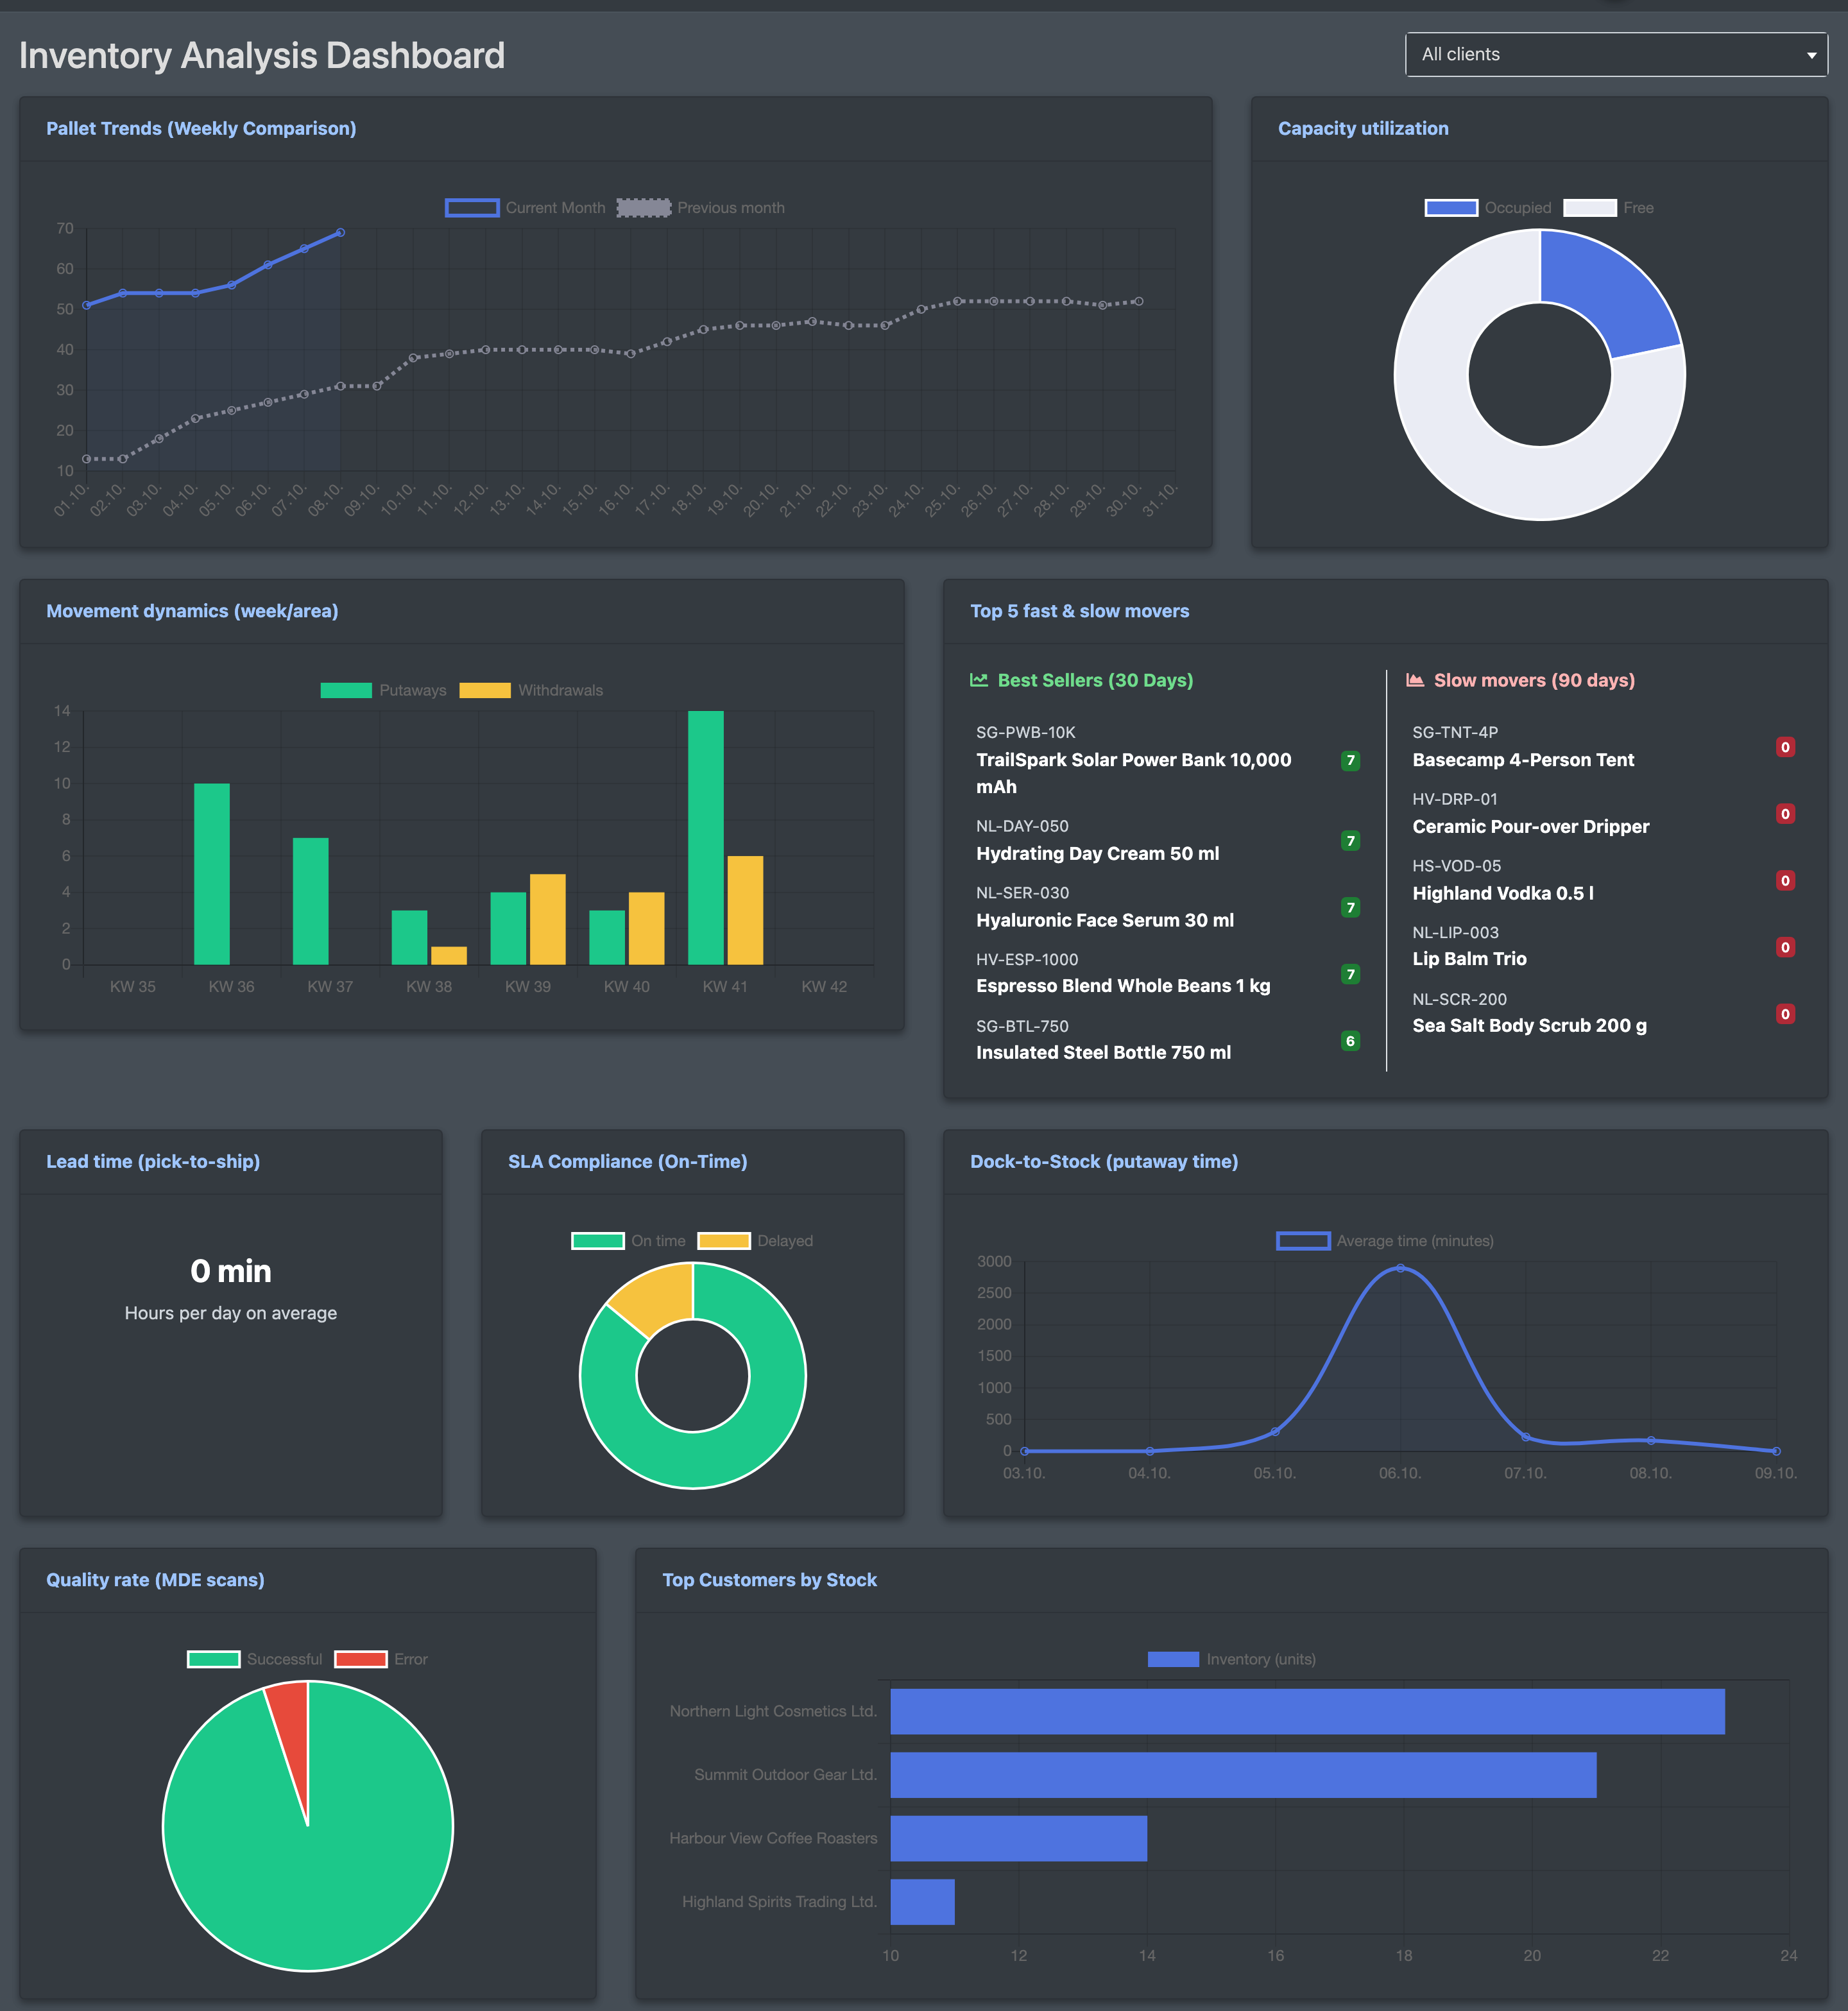
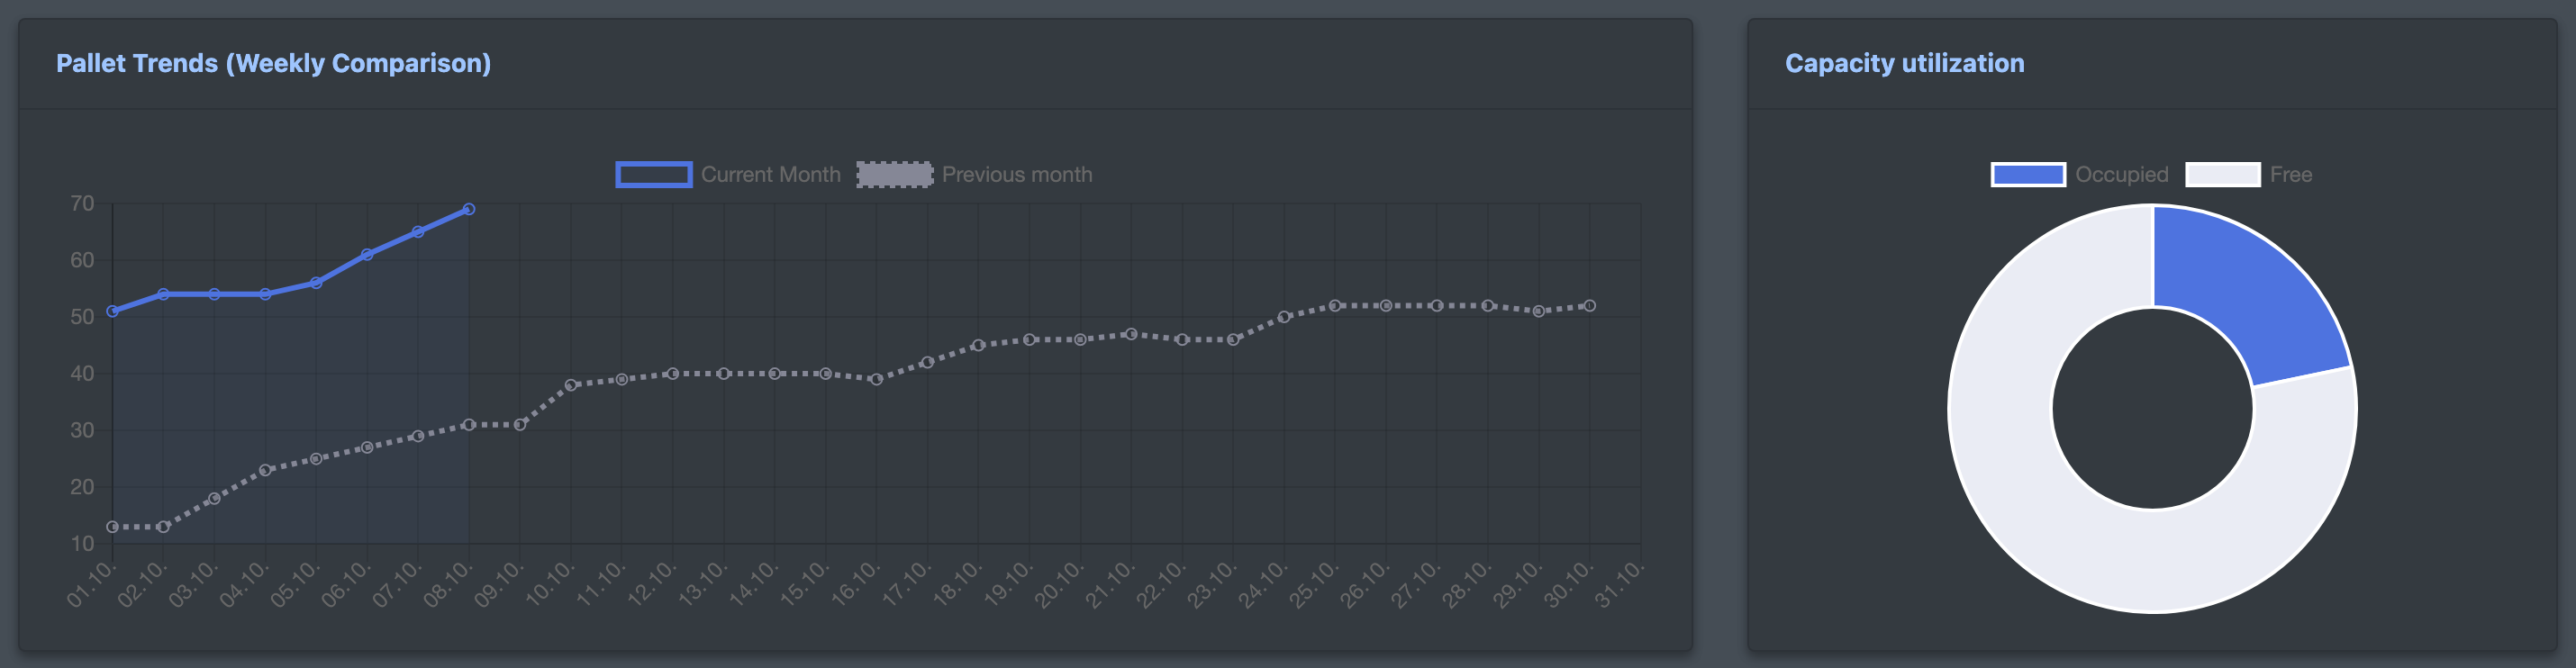
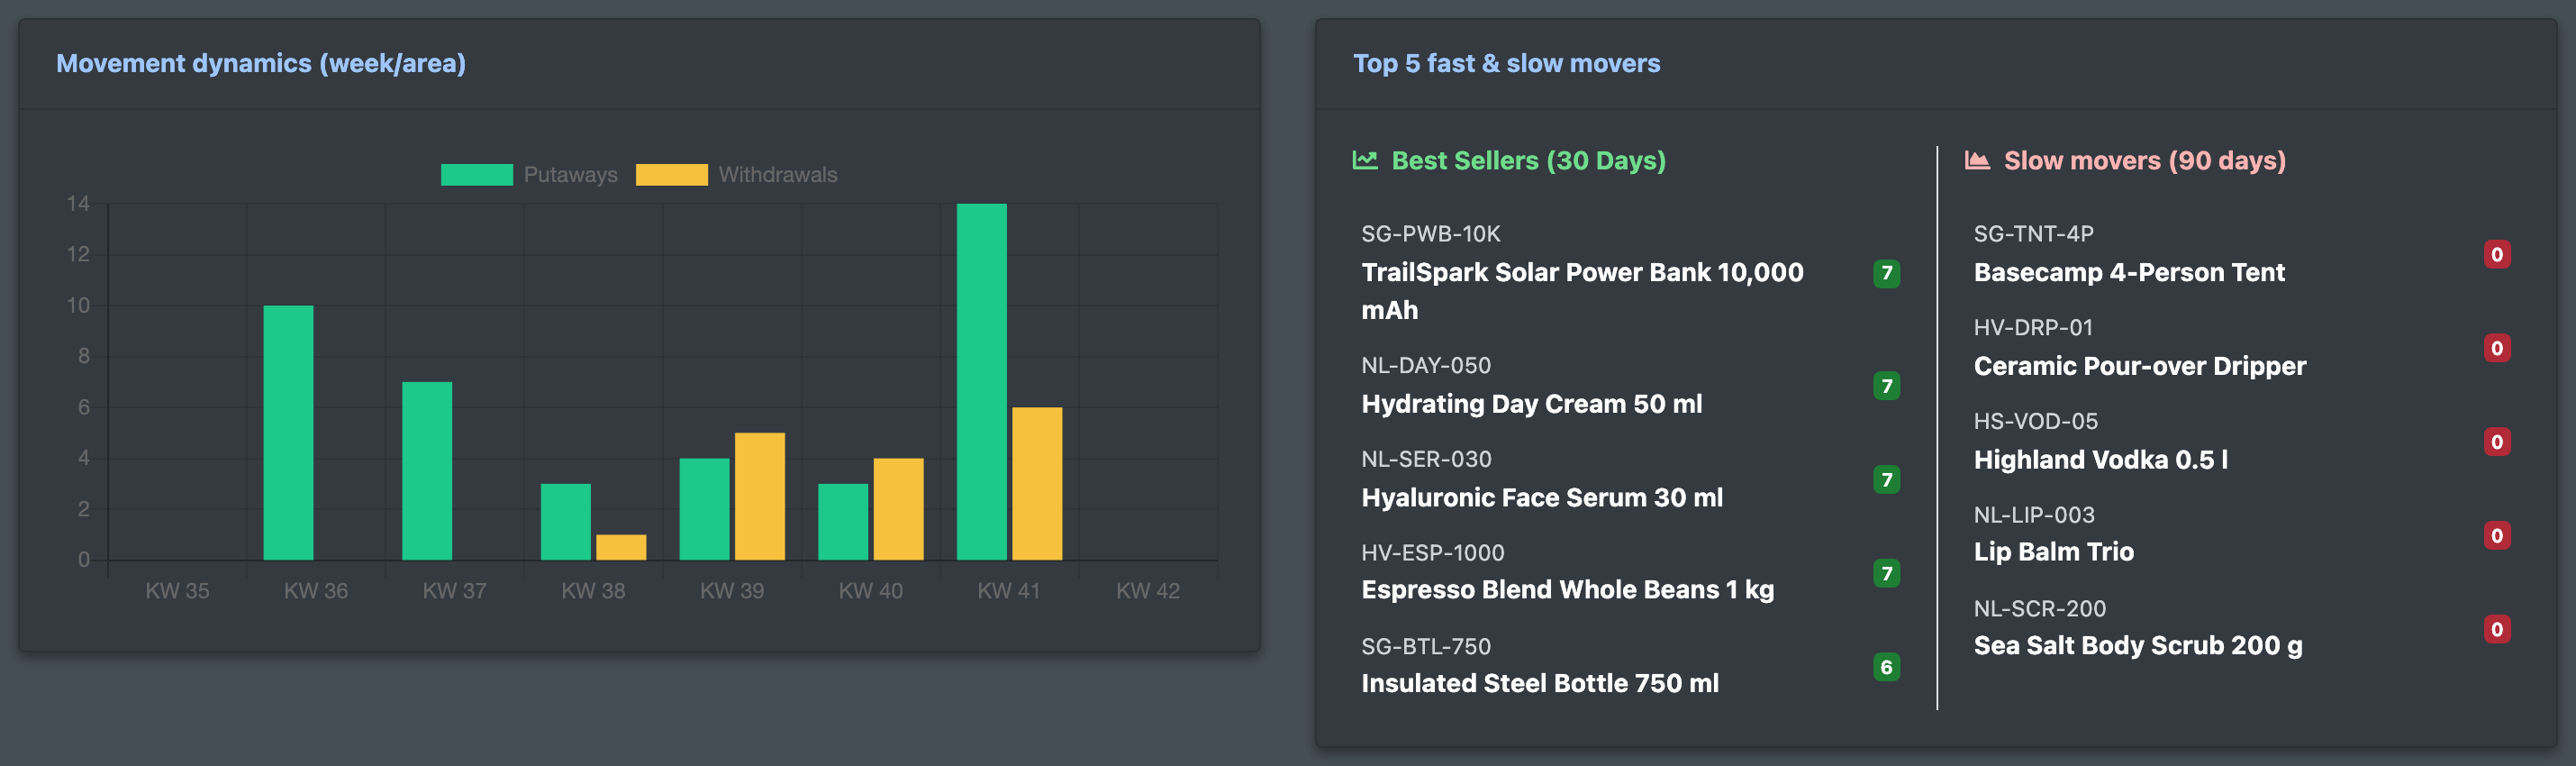
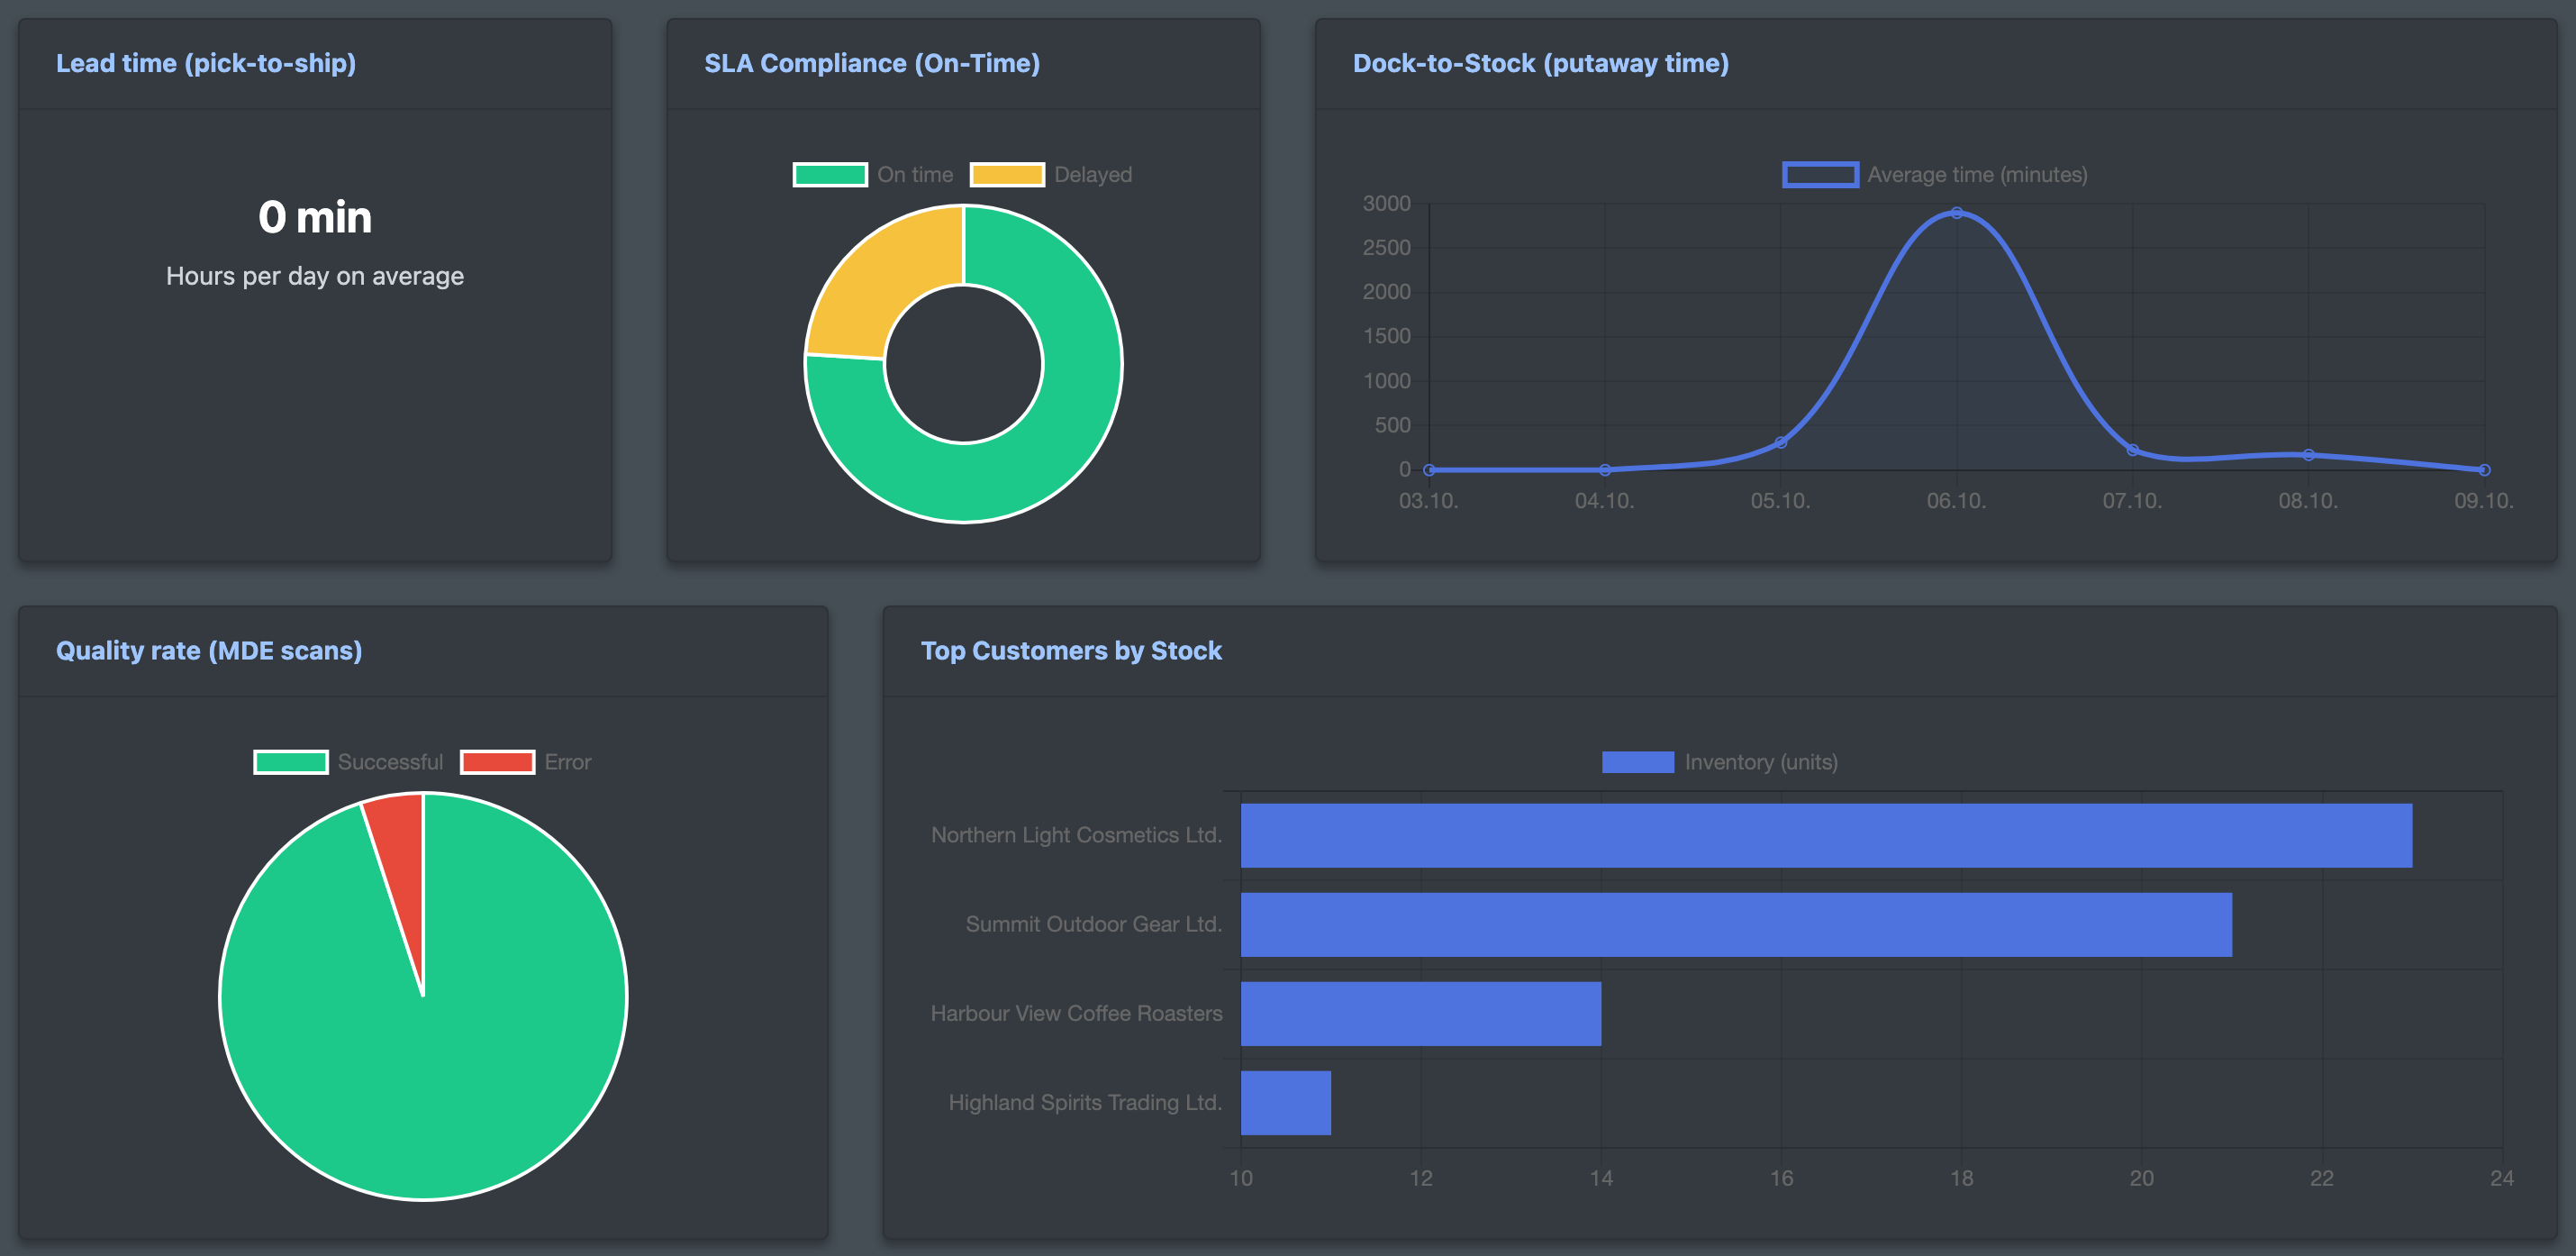
The warehouse dashboard (Lager-Auswertungs-Dashboard) shows the key figures of your warehouse as charts – for all clients together or for one client. You see how the number of pallets develops, how full the warehouse is, how much is moving, which articles sell best and worst, how fast orders go out and how fast deliveries are stored.
Before you start
- Your user needs the permission for Inventory Dashboard (Lager-Dashboard). Ask your administrator if the menu entry is missing.
- The charts are built from your daily operations: putaways and the article history, closed advance notices, picklists (see Create a picklist) and your storage places.
- Pallet Trends (Weekly Comparison) and Top Customers by Stock use the daily pallet snapshots that X-Sitter takes every night, see Storage space costs.
Step by step
- Open WMS › Inventory Dashboard (WMS › Lager-Dashboard).
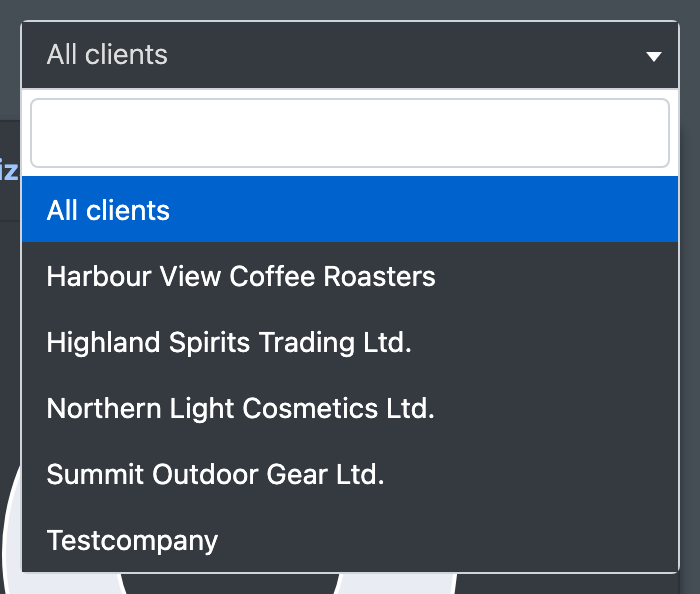
- At the top, choose the Client name (Mandantenname): All clients (Alle Mandanten) or a single client.
- Read the charts (see below).
Charts
Good to know
- Why is Pallet Trends (Weekly Comparison) empty? The nightly pallet snapshots have not run yet, for example in a new warehouse. Wait one night. If the chart stays empty, contact X-Sitter support.
- Dock-to-Stock stays empty. Only closed advance notices are counted. Check that your notices are closed when everything is stored, see Advance notices.
- The dashboard only reads data. Nothing is changed when you open it.